Splines , Glyphs and What not.
So I’ve been working on this app. Application bundling is a whole another story. Thanks to modern AI systems, I’ve been able to pull together a working product in a matter of months. The only thing is , I am not a Frontend guy. No history whatsoever of designing a full fledged frontend webapps. The only thing I know is HTML/CSS and a bit of JS. (did a short react course years ago and have managed to pull up static websites using jekyll but that’s pretty much it).
A quick glimse of what I’ve been working on.

and I’m thiking of calling it BuckBuck.ai. Now on logo designing part, I have been fiddleing around with these svg editors available online. But I want to understand the basics of how these things work. For new designers (nto sure if I can call myself one) , it’s always a good idea to understand the basics of design. But it always starts with playng around with colors , fonts and typography.
I have been a fan of this free design tool by a German Company called schultzschultz . The vibe I think I’m going for is
![]()
Vs
![]()
I don’t know if it is any good. But I like it as a start. And btw what the heck is that?
Design
I’ve always been into design. The idea intrigues me. There is no definition of what term design amounts to. But I feel it’s a combination of pretty much everything ranging from color theory, typography, layout, user experience and so on.
So I decided to take a short detour and understand the basics of modern web design. So that’s what I’m spending this weekend on.
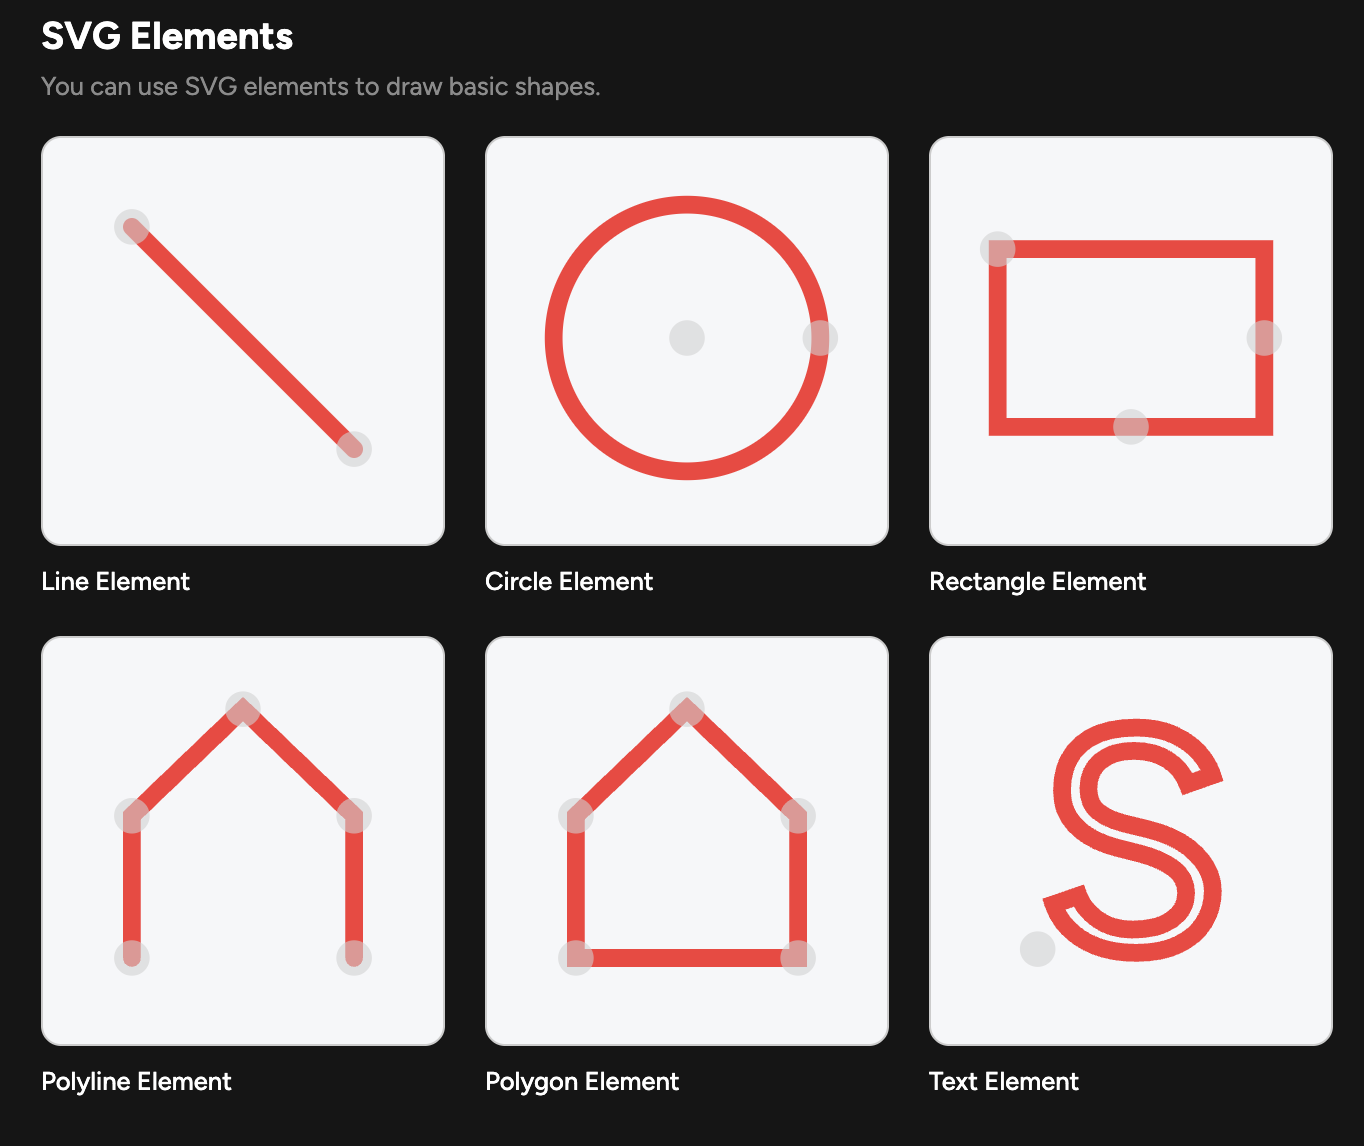
1. SVG
or Scalable Vector Graphics 1 is an XML based markup language for describing two dimensional vector graphics. Unlike raster images which are pixel based, SVGs are vector based and hence can be scaled to any size without loss of quality. This makes them ideal for web use where images need to be displayed on a variety of devices with different screen sizes and resolutions.
fun thing is: they are programmable. You can create and manipulate SVG images using code.
The SVG format supports a wide range of features including shapes, paths, text, gradients, and filters. It also supports interactivity and animation, making it a powerful tool for creating dynamic graphics on the web.
- SVGs are very powerful and flexible tools in designing web graphics. Combined with animations and css, it’s just a matter of time before you can create some really cool stuff.
1.1 So how it works?
We define an svg element with its width and height properties. This defines the drawing canvas where the coordinates go from the 0,0 coordinate from the top-left corner and grow downwards and to the right.
This is like a cartesian plane but with y axis inverted.
In whole <html> <head> structure of a webpage, SVGs are embedded just using a <svg> tag.
Basic structure steps of creating an SVG graphics.2
1
2
3
<svg width="200" height="200">
  <!-- Canvs -->
</svg>
Next we start filling the canvas with shapes. The most basic shape is a rectangle.

Simple rectangle with x,y coordinates x 10 y 10 in a box of height and width 200
1
2
3
<svg width="200" height="200">
  <rect x="10" y="10" width="50" height="50" fill="blue" />
</svg>

1
2
3
4
5
6
7
<svg width="200" height="200">
  <circle
    cx="100"
    cy="120"
    r="70"
  />
</svg>
Finally to add some colour, use fill property. Can use hex codes or rgb values or simply color names.
- SVG Tutorial gives an in depth overview of svg elements along with examples ranging from basic to advanced topics.
Best to play around with it. (editable codepen below). Like the great man once said , “Edit and rerun. Conquer the world.”
See the Pen Untitled by Vaibhav (@vKoder) on CodePen.
Now for more complicated shapes, we don’t always use coordianate system tarting from top left 0, 0 . We use something called viewbox , to define a coordinate system.
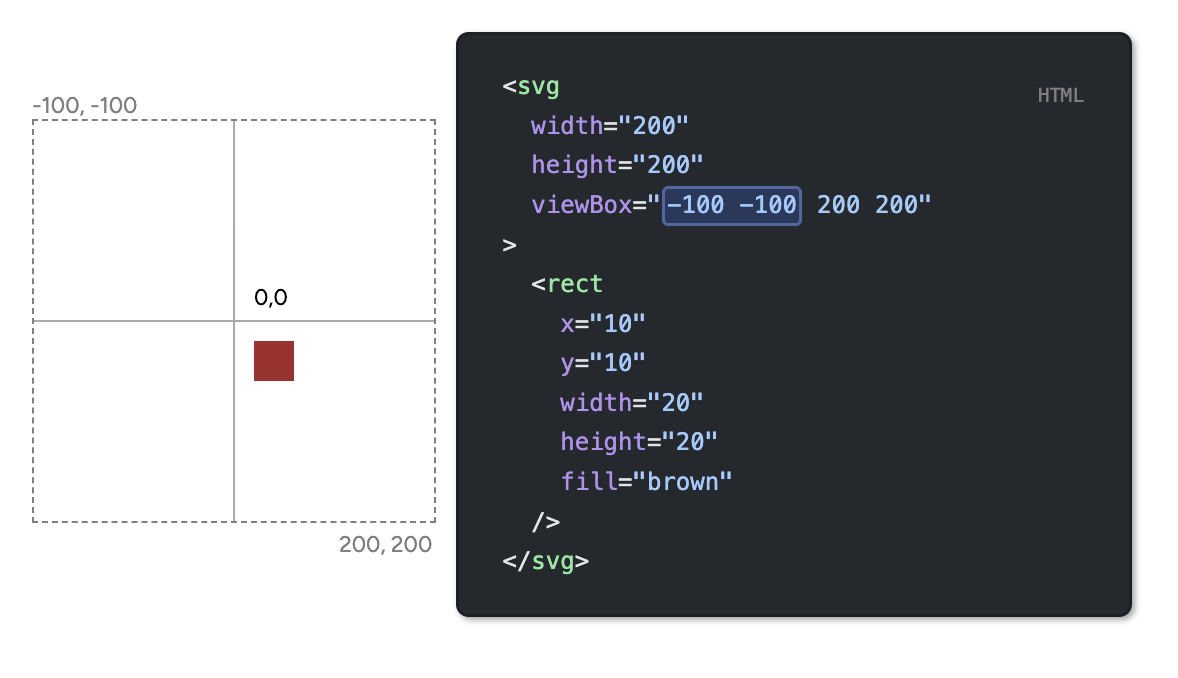
So in essence, it’s to define the area of the canvas and then shift the starting point/point of reference.
viewbox attribute is defined as { min-x ,min-y } { width ,height } where min-x and min-y define the top left corner of the viewbox and width and height define the dimensions of the viewbox.
- This even helps in
scalingthe contents inside the viewbox. So for a canvas dimension of200 x 200, if we define a viewbox of0 0 100 100, the contents inside the viewbox will be scaled to fit the canvas i.e.100 x 100viewbox will be scaled to fit200 x 200canvas.
1.2 Paths and Splines
Paths are the most powerful and complex element in SVG. They are used to create complex shapes and curves that cannot be created using basic shapes like rectangles and circles. Paths are defined using a series of commands and parameters that describe the shape of the path.
So what do I mean by that? Well, paths are defined using a d attribute (for definition) which contains a series of commands and parameters that describe the shape of the path. It’s quite similar to turtle graphics if you have ever used it. (Good old COBOL days :P)
1
2
3
4
5
6
7
8
9
10
11
12
13
14
15
<svg
  width="200"
  height="200"
  viewBox="-100 -100 200 200"
><rect x="-100" y="-100" width="200" height="200"
rx="10" ry="10" fill="white"/>
  <path
    d="
        M -45, -45
        L  45, -45"
    stroke="#ab2727ff"
    stroke-width="15"
    stroke-linecap="round"
  />
</svg>
Mcommand moves the pen to a new location without drawing anything. In this case, it moves the pen to the coordinates (-45, -45). This is the starting point of the path w.r.t. the{-100, -100}topleft corner of the viewbox.Lcommand draws a straight line from the current pen position to the specified coordinates. In this case, it draws a line from (-45, -45) to (45, -45). Move horizontally90units to the right i.e. from-45to45on x axis.strokeattribute defines the color of the line. Here it’s a shade of red.stroke-widthattribute defines the thickness of the line. Here it’s set to 15 units.stroke-linecapattribute defines the shape of the ends of the line. Here it’s set to “round”, which means the ends of the line will be rounded.
MoveTo commands can be used via both
Mandm. Also ‘L’ and ‘l’ are used for lineTo commands. The difference is that uppercase letters denote absolute coordinates, while lowercase letters denote relative coordinates. For example,M 10 10moves the pen to the absolute coordinates (10, 10), whilem 10 10moves the pen 10 units to the right and 10 units down from its current position.
1.2.1 Enough chatter, time to dive in.
Following the design patterns as explained here , I am going to make simple logos using paths.
Following steps:
- Create a canvas of
200 x 200with a viewbox of-100 -100 200 200 - Draw a horizontal line from
(-45, -45)to(45, -45) - Draw a vertical line from
(-45, -45)to(-45, 45) - Draw a Diagonal line from
(-45, -45)to(45, 45)
1
2
3
4
5
6
7
8
9
10
11
12
13
14
15
16
17
18
19
20
<svg
  width="200"
  height="200"
  viewBox="-100 -100 200 200"
><rect x="-100" y="-100" width="200" height="200"
 rx="10" ry="10" fill="white"/>
  <path
    d="
        M -45, -45
        L  45, -45
        M -45, -45
        L -45,  45
        M  -45, -45
        L  45, 45
    "
    stroke="#ab2727ff"
    stroke-width="15"
    stroke-linecap="round"
  />
</svg>
Example 1
1
2
3
4
5
6
7
8
9
10
11
12
13
14
15
16
17
18
19
20
<svg
  width="200"
  height="200"
  viewBox="-100 -100 200 200"
><rect x="-100" y="-100" width="200" height="200"
rx="10" ry="10" fill="white"/>
  <path
    d="
        M 45, -45
        L  45, 45
        M 45, -45
        L -45,  -45
        M  45, -45
        L  -45, 45
    "
    stroke="#ab2727ff"
    stroke-width="15"
    stroke-linecap="round"
  />
</svg>
Example 2
1
2
3
4
5
6
7
8
9
10
11
12
13
14
15
16
17
18
19
20
21
22
23
24
25
26
27
28
29
30
31
32
33
34
35
36
37
38
39
40
41
42
43
44
45
46
47
48
49
50
51
52
53
54
55
56
57
58
59
60
61
62
63
64
65
66
67
68
69
70
<div>
<svg
  width="200"
  height="200"
  viewBox="-100 -100 200 200"
  xmlns="http://www.w3.org/2000/svg"

><rect x="-100" y="-100" width="200" height="200"
rx="10" ry="10" fill="#ffffffff"/>
  <path
    d="
        M 75, -75
        L  75, -25
        M 75, -75
        L  25, -75
        M 75, -75
        L 25, -25

    "
    stroke="#ab2727ff"
    stroke-width="10"
    stroke-linecap="round"
  />

    <path
    d="
        M -75, -75
        L  -25, -75
        M -75, -75
        L  -75, -25
        M -75, -75
        L -25, -25

    "
    stroke="#ab2727ff"
    stroke-width="10"
    stroke-linecap="round"
  />

      <path
    d="
        M -75, 75
        L  -75, 25
        M -75, 75
        L  -25, 75
        M -75, 75
        L -25, 25

    "
    stroke="#ab2727ff"
    stroke-width="10"
    stroke-linecap="round"
  />

        <path
    d="
        M 75, 75
        L  75, 25
        M 75, 75
        L  25, 75
        M 75, 75
        L 25, 25

    "
    stroke="#ab2727ff"
    stroke-width="10"
    stroke-linecap="round"
  />
</svg>
</div>
Example 3
LineTo commands are
Landl. ButHandhare used for horizontal lines andVandvare used for vertical lines. The difference is that uppercase letters denote absolute coordinates, while lowercase letters denote relative coordinates. For example,H 50draws a horizontal line to the absolute x-coordinate of 50, whileh 50draws a horizontal line 50 units to the right from the current position.
This took total of
12line segments and12mvoing the tip of the pen.
This is definitely not the best way to go forward.
Alright, thankfully we can use polylines to reduce the number of move & draw routine.
1.2.2 Polylines
The SVG
points Attribute: This is the most crucial attribute, defining the vertices of the polyline. It takes a list of
xandycoordinate pairs, separated by spaces. For example,points="10,10 50,20 30,60"would create a polyline connecting(10,10)to(50,20)and then to(30,60).- Stroke Properties:
stroke: Sets the color of the line.stroke-width: Sets the thickness of the line.stroke-linecap: Determines the shape of the line endings (e.g., butt, round, square).stroke-linejoin: Determines the shape of the corners where lines meet (e.g., miter, round, bevel). - Fill Properties:
fill: Specifies the color used to fill the area enclosed by the polyline. If the polyline is not a closed shape (i.e., the last point is not connected to the first), the fill will connect the starting and ending points along the closest path. Setting fill=”none” removes the fill.
1
2
3
4
5
6
7
8
<svg width="200" height="200">
    <rect x="-100" y="-100" width="200" height="200"
fill="white"/>
  <polyline points="20,20 40,25 60,40 80,
  120 120,140 140,180"
 style="fill:none;stroke:blue;stroke-width:3" />
</svg>
Example :
stroke-linejoin: controls the rounding of corners in paths. It’s set to miter by default, which means corners are sharp. You can use round to create rounded corners. 3.
stroke-linecap: controls the rounding of terminal paths (“caps”), like on the ends of lines or polylines. Its default is butt, which gives you flat terminal ends. If you set it to round, you’ll get rounded terminals. 3
Polylines are a great way to reduce the number of commands needed to draw complex shapes. However, they are limited to straight lines only. For curves, we need to use Bézier curves or arcs.
1.2.3 Bézier Curves
Bézier curves are parametric curves used in computer graphics and related fields to produce smooth and scalable curves. They are defined by a set of control points, which determine the shape of the curve. The most common types of Bézier curves are quadratic and cubic Bézier curves.
1. Quadratic Bézier Curves:
A quadratic Bézier curve is defined by three points: a starting point, an ending point, and a single control point. The curve starts at the starting point, is pulled towards the control point, and ends at the ending point.
The SVG command for a quadratic Bézier curve is Q (absolute) or q (relative). The syntax is as follows:
1
Q control-point-x control-point-y end-point-x end-point-y
For example, Q 50 0 100 100 draws a quadratic Bézier curve from the current point to (100, 100) with a control point at (50, 0).
1
2
3
4
<svg width="200" height="200">
  <path d="M 10 80 Q 95 10 180 80" stroke="black"
  fill="transparent"/>
</svg>
Example : Quadratic Bézier Curve
2. Cubic Bézier Curves:
A cubic Bézier curve is defined by four points: a starting point, an ending point, and two control points. The curve starts at the starting point, is influenced by both control points, and ends at the ending point.
The SVG command for a cubic Bézier curve is C (absolute) or c (relative). The syntax is as follows:
1
C control-point1-x control-point1-y control-point2-x control-point2-y end-point-x end-point-y
For example, C 50 0 150 200 200 100 draws a cubic Bézier curve from the current point to (200, 100) with control points at (50, 0) and (150, 200).
1
2
3
4
5
6
7
<svg width="200" height="200">
    <rect x="0" y="0" width="200" height="180"
fill="white" rx="10" ry="10"/>
  <path d="M 10 80 C 40 10, 65 10, 95 80 S 150 150,
   180 80"
  stroke="black" fill="transparent"/>
</svg>
Example : Cubic Bézier Curve
Bézier curves are widely used in computer graphics, animation, and user interface design due to their flexibility and ease of use. They allow designers to create smooth and complex shapes with just a few control points.
1.2.4 Wait? What are Control Points?
Control points are specific points that influence the shape and direction of a Bézier curve. They do not lie on the curve itself but act as “magnets” that pull the curve towards them, determining its curvature and overall form.
For a quadratic Bézier curve, there is one control point, while for a cubic Bézier curve, there are two control points. The position of these control points relative to the start and end points of the curve affects how “tight” or “loose” the curve appears.
So, if you move a control point closer to the start or end point, the curve will be tighter and more pronounced. Conversely, if you move the control point further away, the curve will be looser and more gradual.
A Bézier curve uses a number of control points equal to its degree plus one. The number of control points determines the type of curve; for instance, a linear Bézier curve has two control points, a quadratic Bézier curve has three, and a cubic Bézier curve has four.
Here’s a breakdown:
- Linear Bézier Curve: Defined by two control points.
- Quadratic Bézier Curve: Defined by three control points.
- Cubic Bézier Curve: Defined by four control points.
In general, a Bézier curve of order
nhasn+1control points, labeled $P_0$ through $P_n$.
Why can’t I simply draw the curves?
I mean isn’t it easy to simply draw the curves if we know the path? Just store all the points and draw through each one of them? This sounds easy. But the problem is that storing all the points would require a lot of memory and processing power, especially for complex curves.
But if we intuitively think about it, we can define a curve using a few control points and then use mathematical equations to calculate the points on the curve.
And we have been using control points all along.
- To draw a line, we need two points (start and end) and then we can draw a straight line between them. No need to store all the points in between.
- To draw a circle, we need a center point and a radius and then we can draw the circle using rendering all points on the circumference.
- To draw an ellipse, we need a center point and two radii (one for the x-axis and one for the y-axis) and then we can draw the ellipse using rendering all points on the boundary.
So essentially,
control pointsare a way to define a curve using a few points and then use mathematical equations to calculate the points on the curve. This is much more efficient than storing all the points on the curve.
Naah this isn’t convincing enough
Alright, let’s take a look at how Bézier curves are mathematically defined.
1. Linear Bézier Curve: A linear Bézier curve is simply a straight line between two points, $P_0$ and $P_1$. The equation for a linear Bézier curve is:
\[B(t) = (1 - t)P_0 + tP_1 \quad \text{for } t \in [0, 1]\]So as t varies from 0 to 1, the point B(t) moves linearly from $P_0$ to $P_1$.
2. Quadratic Bézier Curve: A quadratic Bézier curve is defined by three points: $P_0$, $P_1$, and $P_2$. The equation for a quadratic Bézier curve is:
\[B(t) = (1 - t)^2 P_0 + 2(1 - t)t P_1 + t^2 P_2 \quad \text{for } t \in [0, 1]\]Here, B(t) is a weighted average of the three points, with the weights determined by the parameter t. As t varies from 0 to 1, the point B(t) moves along the curve defined by the three points.
3. Cubic Bézier Curve: A cubic Bézier curve is defined by four points: $P_0$, $P_1$, $P_2$, and $P_3$. The equation for a cubic Bézier curve is:
\[B(t) = (1 - t)^3 P_0 + 3(1 - t)^2 t P_1 + 3(1 - t) t^2 P_2 + t^3 P_3 \quad \text{for } t \in [0, 1]\]Again, B(t) is a weighted average of the four points, with the weights determined by the parameter t. As t varies from 0 to 1, the point B(t) moves along the curve defined by the four points.
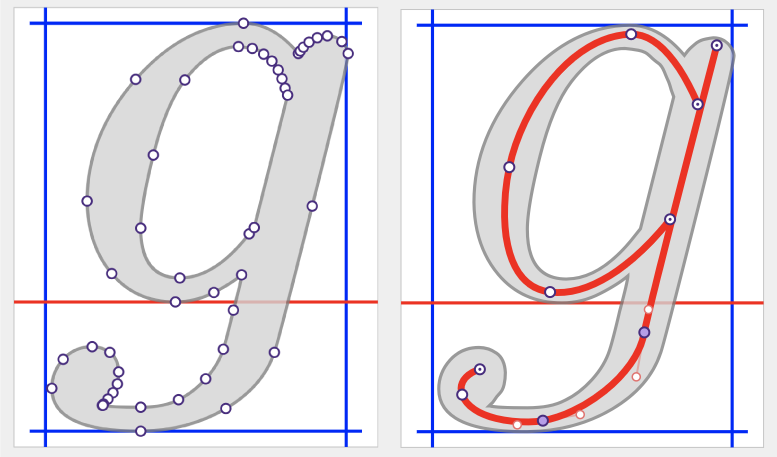
1.2.4 Waiting, what about Glyphs?
Glyphs are essentially vector shapes that represent characters in a font. Each character in a font is represented by a unique glyph, which is defined using vector graphics. This allows the glyphs to be scaled to any size without loss of quality, making them ideal for use in digital typography.
I’m tired for today. Will continue this later.. zzz
Sources: